

A Report by Dr. Peter Navarro. Released February 2020.
Introduction
All Americans, not only in the States most heavily affected but in every place in this country, are rightly disturbed by the large numbers of illegal aliens entering our country. The jobs they hold might otherwise be held by citizens or legal immigrants. The public services they use impose burdens on our taxpayers.
President Bill Clinton, 1995(1)
President Trump and his Administration took decisive action to handle a dangerous influx of illegal aliens which had plagued our nation for decades with spikes in violent crimes such as homicides, robbery, sex offenses, and kidnappings,(2) and costs Americans over $100 billion annually.(3) As of January 2021, over 450 miles of border wall had been erected,(4) harmful sanctuary city, refugee resettlement, and catch-and-release policies had been reformed, and as evidence of their effectiveness, illegal immigration crossings where our border wall is constructed are down by 87%. (5)
However, after the Biden Regime was installed after an election rampant with voting irregularities, the Open Border Left wasted no time in unravelling many of the actions Donald J. Trump invoked to keep our borders strong and secure.
For example, the Biden Regime revokes President Trump’s 2017 Executive Orders to defund sanctuary cities and strengthen immigration laws,6 and to install a travel ban on individuals that come from nations that support terrorism.
The US government has spent nearly $1 billion maintaining a wall around the US Capitol building, paradoxically proving the efficacy of physical protective barriers. Simultaneously, the Biden-Harris Regime halts construction of President Trump’s border wall7 – a critical deterrent component that had drastically decreased border trespassing over the past four years.
Biden’s Open Borders initiatives will flood America with illegal laborers, at a time when over 10.7 million Americans8 are still suffering from unemployment due to the Chinese Communist Party Virus pandemic. Such unfair labor market competition will also put enormous downward pressure on wage growth for American citizens.
This special edition of the Navarro seeks to demonstrate and explain the following:
- Which countries are illegal aliens coming from and what are their demographic profiles?
- What forces incentivize these illegal aliens to migrate north in such large numbers and why is it so easy for illegal aliens to take up residence in the United States?
- What will be the likely fallout of illegal mass migration: facilitated by the Biden-Harris Regime on for American taxpayers, labor markets, American children in our K-12 public schools, and crime?
- How did the Trump Administration combat the dangers of mass illegal migration, mitigate the fiscal burden of illegal immigration, and what were the effects of these policies?
I. Illegal Mass Migration Across America’s Southern Border
A. Major Routes for Illegal Mass Migration
Figure One illustrates the major routes for the illegal mass migration along America’s southern border with Mexico.9 These migrant routes, through Guatemala’s northern border, are fed from Central and South America, and as far away as Brazil. These routes accommodate everything from single adults and children to large caravans. They provide illegal alien access into the U.S. along a 1,933 mile border10 that stretches from San Diego and the Pacific Ocean to the southern tip of Texas across California, Arizona, New Mexico, and Texas.
Figure One: Map of the Migratory Routes from Central America to the Southwest Border
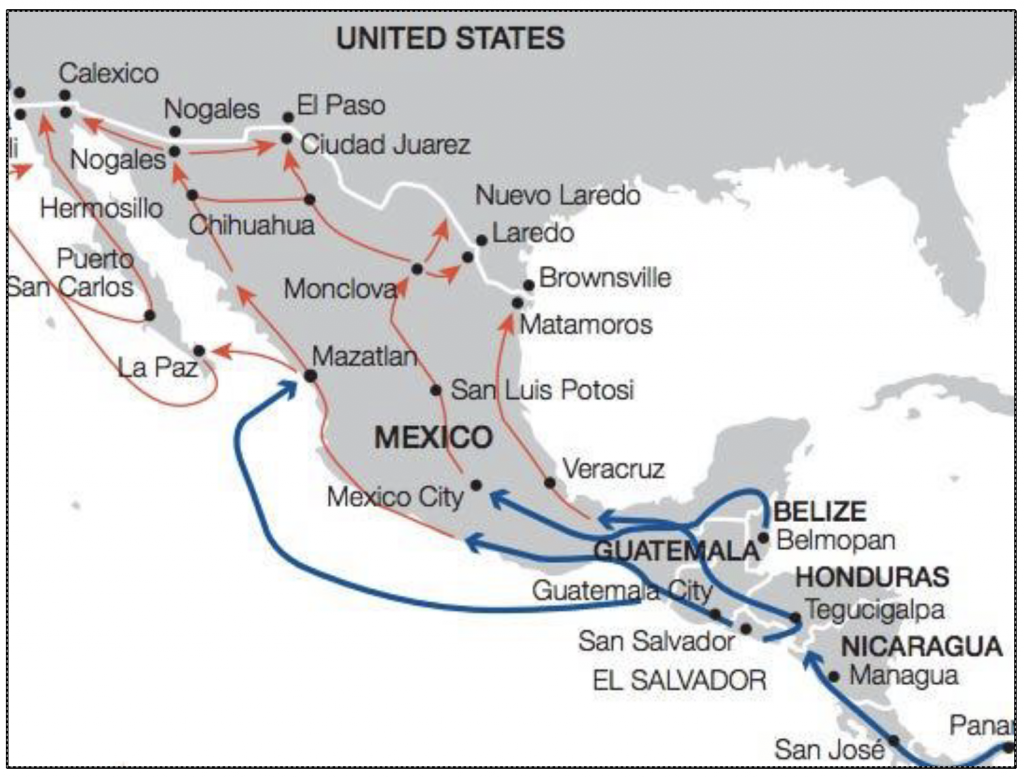
Source: World Economic Forum(11)
On any given day, thousands of illegal aliens travel along these migratory routes.(12) Approximately half of this traffic will consist of family units, usually with young children and teenagers below the age of 18.(13) As of FY19, there were also over 76,000 unaccompanied minors crossing over the Southern Border.(14) Under one third of all illegal aliens that cross the southern border are female.(15)
Along the perilous journey north and underscoring the depths of the humanitarian crisis this illegal mass migration invites, almost 70% of the travelers will likely be subjected to some form of violence.(16) As noted by Amnesty International, well over half of all adult females will likely submit to “cuerpomátic,” a Spanish slang term meaning “rape in exchange for migration assistance into the U.S.”(17) Such tragic statistics reveal the hypocrisy of American leftists who promote porous border policies as somehow humanitarian.
Upwards of 90 percent of illegal aliens crossing the border pay a “Coyote”—a smuggler and guide—to get them across the border.(18) Coyotes have been known to abandon those in the desert who are physically incapable of the long journey. Coyotes have also been known to take more perilous routes than the typical migratory route, with the aim of smuggling drugs as well.(19)
B. Illegal Alien Mass Migration Patterns Across America’s Southern Border
Table One provides a summary of the illegal alien traffic crossing America’s southern border during FY15-FY20, as provided by the Department of Homeland Security’s Customs and Border Protection (CBP).
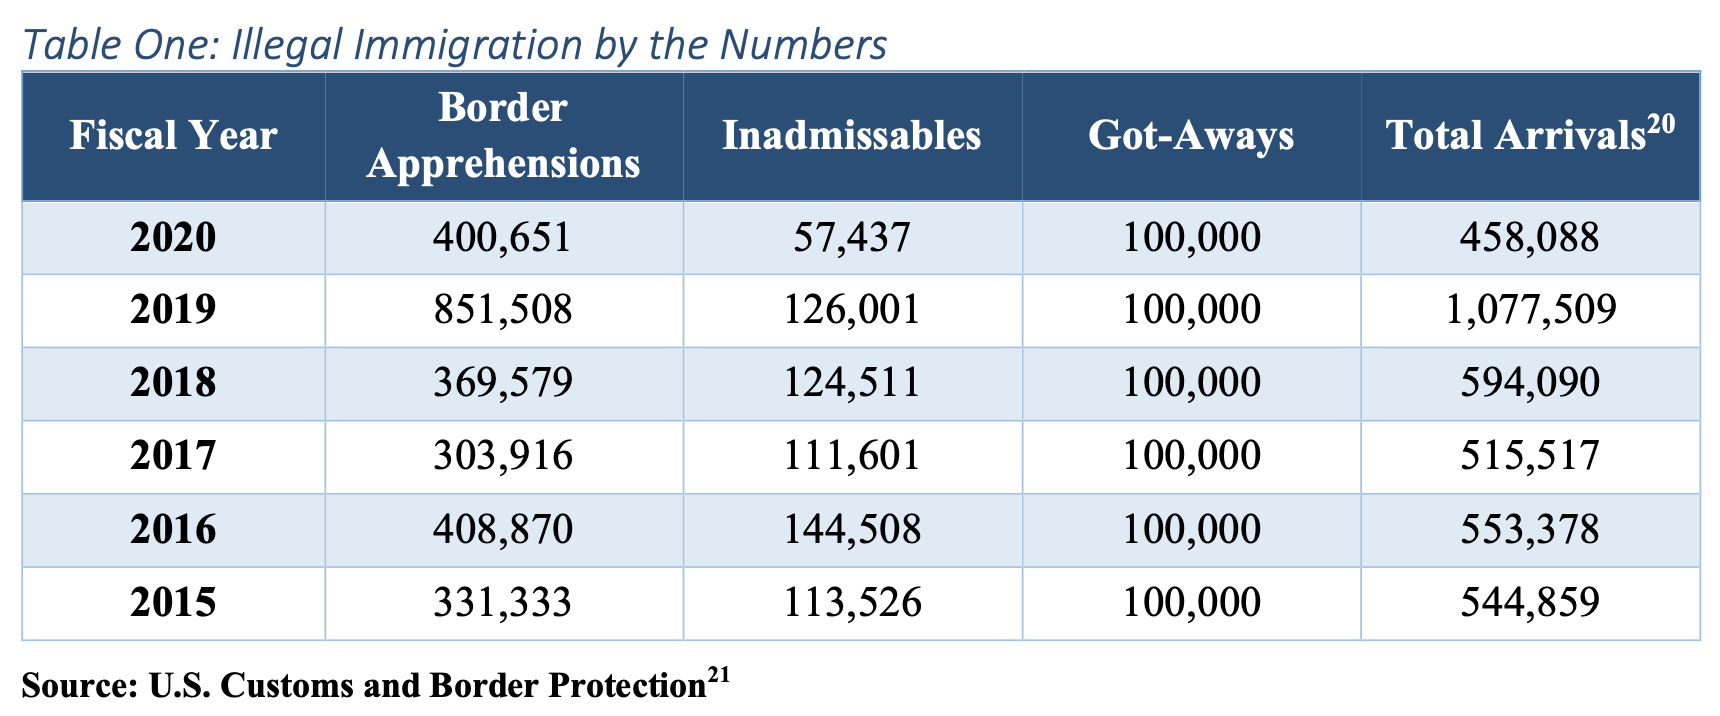
Source: U.S. Customs and Border Protection(21)
The table shows that 458,088 illegal aliens were apprehended at the border in FY20.(22) This is nearly a 50% decrease in apprehensions compared to FY19.
Under current “catch and release” laws (discussed in Section IV below), many of these 458,088 illegal aliens who have been “caught” have been, or will soon be, released into the interior of the United States.(23)
Column 3 displays another 57,437 “inadmissables” recorded during FY20, or illegal aliens who come to a U.S. port of entry seeking asylum or protection.(24) Most inadmissables likewise have been, or will be, released into the interior of the U.S.
Column 4 catalogues a standard estimation of annual “got-aways.” This CBP classification refers to those crossing the border and entering the interior of the U.S. without being apprehended by CBP.(25) This number varies as more information is gathered, but the prediction has rested well above 100,000 per annum for the past five years.(26)
Based on this data, and even with monthly border apprehensions declining in the last two fiscal years,27 the total number of illegal aliens settling in the U.S. between FY19 and FY20 reached nearly 1.5 million.(28)
In FY20, ICE conducted over 103,600 administrative arrests, which consists of illegal aliens who are believed to have committed additional criminal activity beyond immigration violations.(29) Of these 103,600 administrative arrests, 90 percent of those arrested had criminal convictions or pending criminal charges, along with egregious criminal histories including more than 1,800 homicide-related offenses, 1,600 kidnappings, 3,800 robberies, 37,000 assaults, and 10,000 sex crimes.(30)
Finally, among illegal aliens removed from the U.S. in FY18, an alarming 44% of them had previous criminal backgrounds.(31) Moreover, these prior crimes were not minor ones. Over 18,000 of them had charges dealing with dangerous drugs, over 12,000 had assault charges, 3,000 had weapon charges, and 4,500 had sexual assault and offenses charges.(32)
C. Illegal Mass Migration by Nationality
Figure Two provides a breakdown by major countries of origin for illegal migrants for FY19.
Figure Two: FY19 Illegal Immigration Through the Southern Border, Countries of Origin
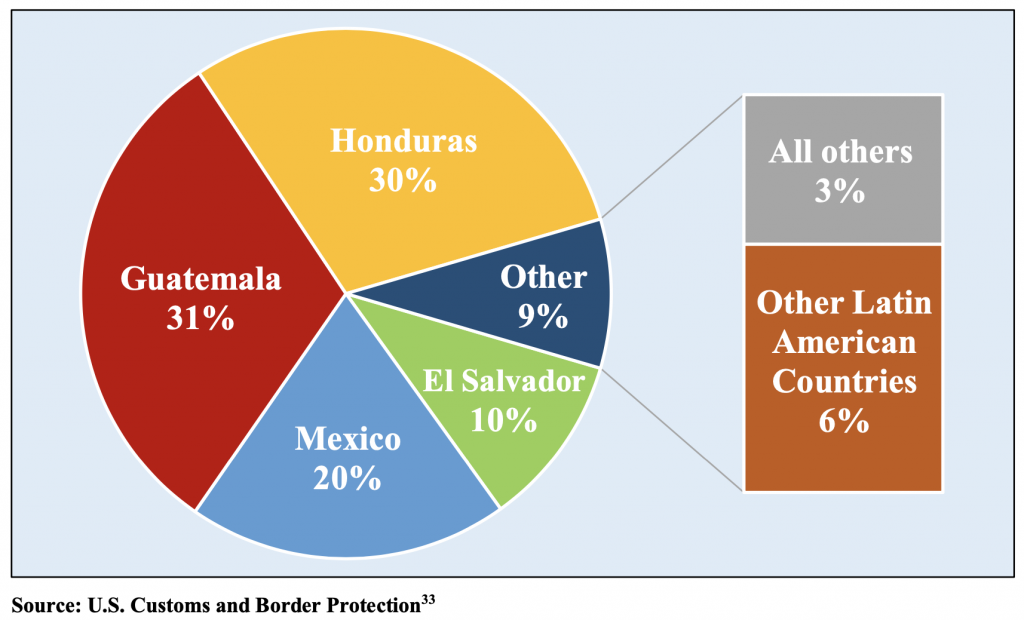
From the chart, we see that almost 20% of illegal aliens crossing our southern border in FY19 came from Mexico—half of the share of Mexican aliens from FY18. Another 71% came from the “Northern Triangle” countries of El Salvador, Guatemala, and Honduras.(34) Mexico and the Northern Triangle thereby account for over 91% of the illegal aliens crossing America’s southern border.(35)
Those illegal aliens crossing the southern border who are not from Mexico or Central America originate from more than 20 other countries.(36) Many will transit into this hemisphere via Brazil, a gateway for illegal aliens from South Asian countries like Bangladesh, India, Nepal, and Pakistan.(37) As of FY18, India, alone accounted for approximately 7,500 illegal aliens per year crossing into the U.S. from the southern border.(38)
D. A Northern Triangle Surge
Table Two illustrates a significant surge from FY18 to FY19 in illegal alien flow from the Northern Triangle countries of El Salvador, Guatemala, and Honduras. This surge is evident in both the number of persons and the percent of the overall traffic – even as Mexican illegal immigration is falling as a percent share of the total.
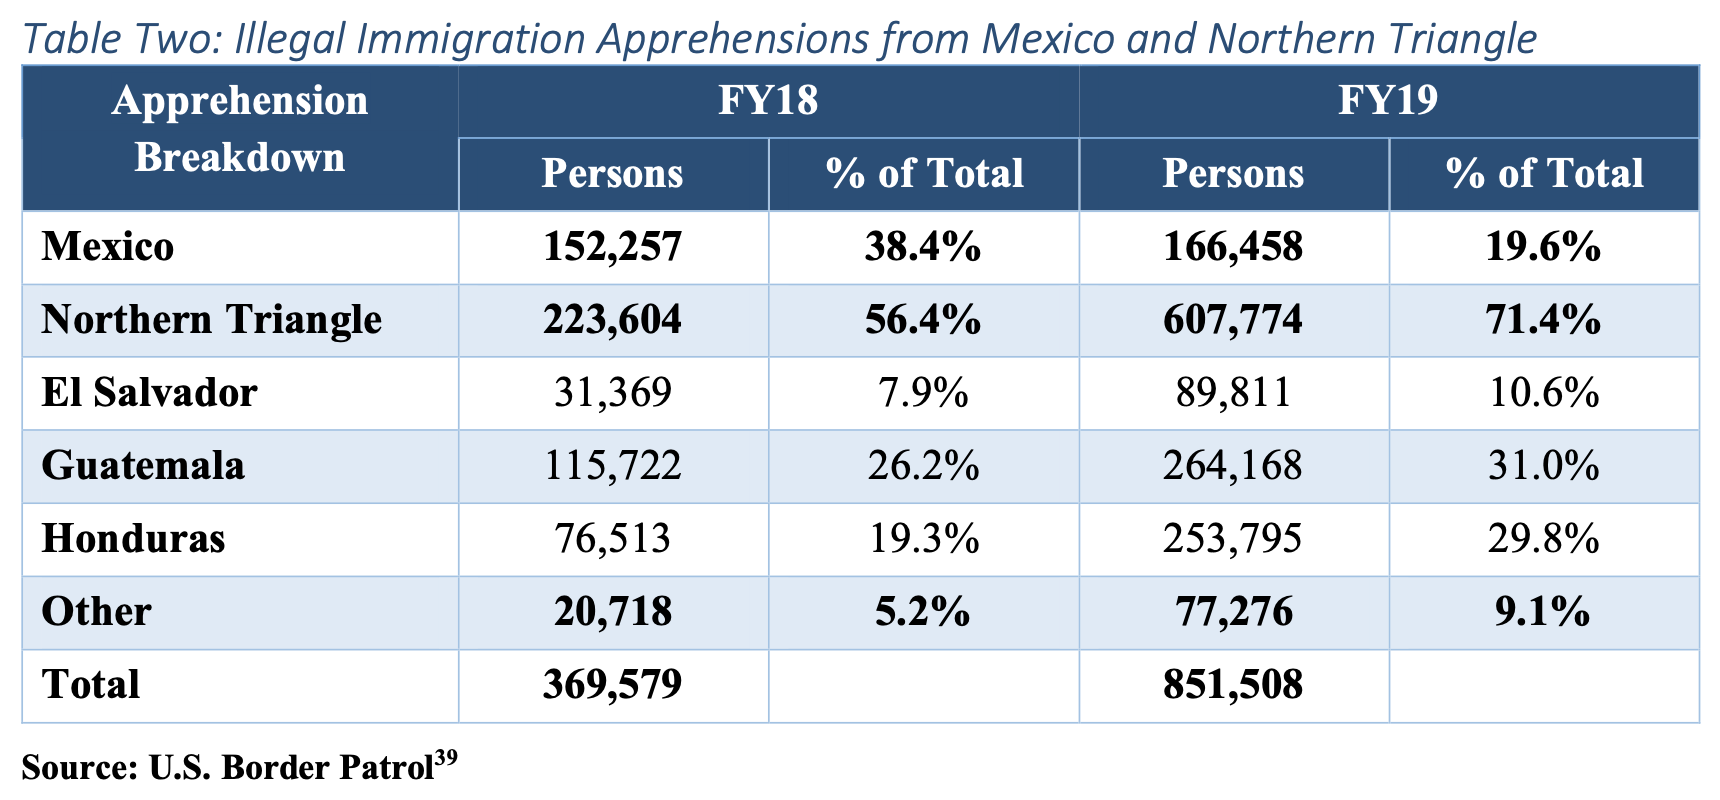
From the table, we can observe that between FY18 and FY19, Northern Triangle illegal alien traffic tripled, from 223,604 illegal aliens to 607,774 — a 172% increase. At the same time, the percent of the total flow from the Northern Triangle rose from 56% to 71% while the traffic from Mexico fell from 38% to 20% of the total (but not in absolute numbers).
At a more granular level, we can also observe that Honduras underwent the largest percent increase in persons apprehended — approximately 232% — from 76,513 to 253,795. Meanwhile, Guatemala accounted for the largest share of illegal aliens from the Northern Triangle apprehended in FY19. Its total of 264,168 represents nearly a third of the FY19 traffic through the southern border. (40)
E. Education Levels, English Language Proficiency, and Occupations
Table Three reports the educational attainment and English proficiency of the citizens of Mexico and the Northern Triangle countries, which together account for over 90% illegal alien traffic across America’s southern border.
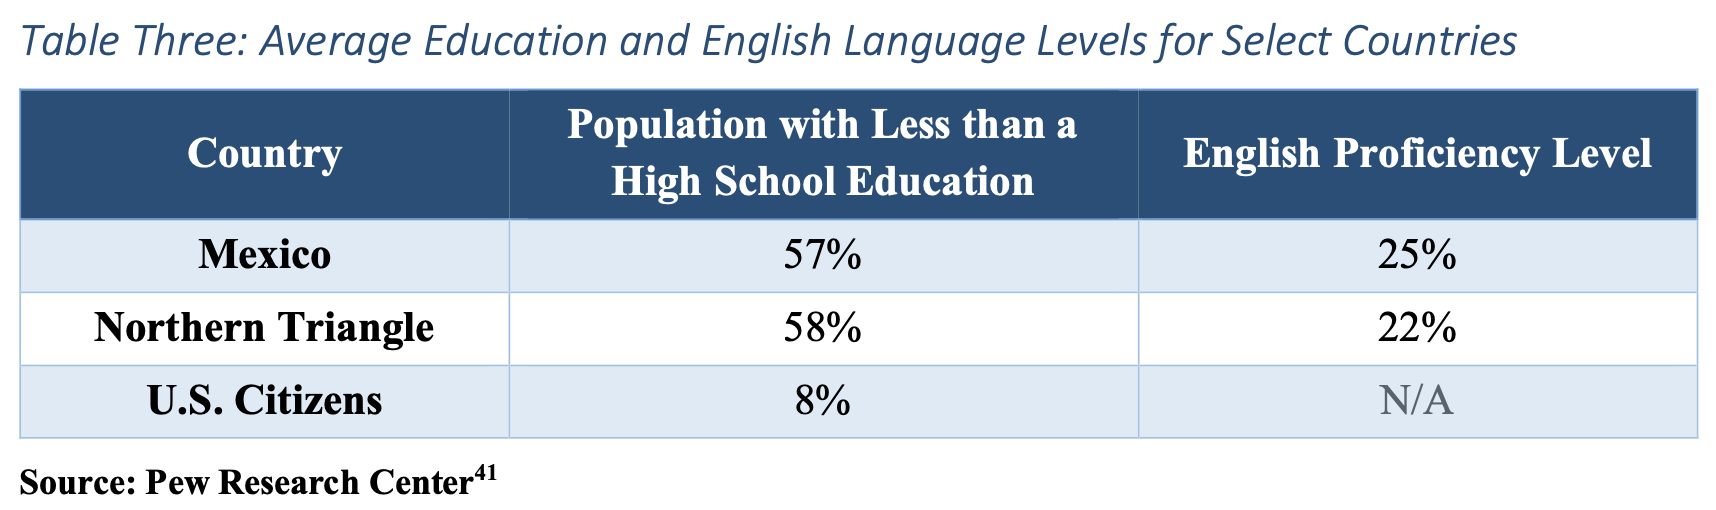
Note that 75% of Mexican citizens lack English proficiency while 78% Northern Triangle citizens lack such proficiency.(42) Almost 60% of the citizens of Mexico and the Northern Triangle countries have less than a high school education, in comparison to just 10% of U.S. citizens.
This data underscores that the vast majority of the illegal aliens crossing America’s southern border and taking up residency in the United States today are poorly educated and lack English proficiency skills. This reality is a critical observation when seeking to assess the various fiscal and other economic impacts of immigration across America’s Southern border.
Those illegal aliens crossing America’s southern border that find jobs will likely work in occupations that are substantially lower-paying occupations such as landscaping, crop production, maid/janitorial and other building services. The five occupations in Table Four represent over 40% of the illegal alien workforce.
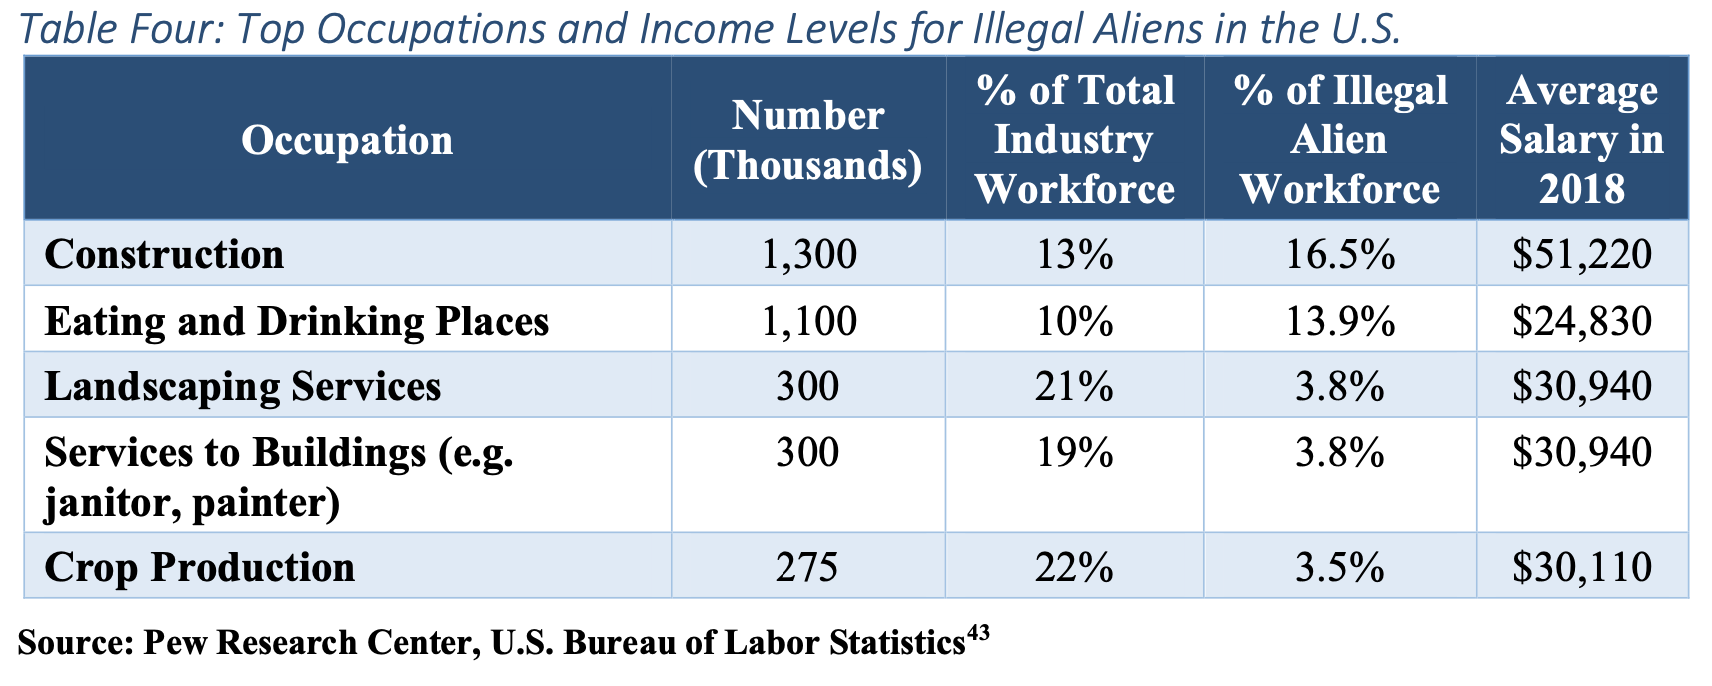
Of these occupations, only construction jobs pay an average annual salary at $51,220 that is nearly equal to the annual average salary for U.S. workers of $51,960.44
In many of these occupations, illegal aliens constitute a significant share of the total industry workforce. For example, while illegal aliens constitute only about 3.2% of the U.S. population,45 they account for an estimated 21% of landscaping service workers, 19% of janitorial and other building service workers, and 22% of crop production jobs.(46)
Illegal aliens also represent a disproportionate share of the workforce in a number of states relative to the size of the illegal alien population. While illegal aliens represent roughly 5% of the workforce in the U.S. nationally, in Nevada, for example, illegal aliens represent over 10% of the state’s workforce.47 In California, Texas, and New Jersey, illegal aliens comprise 9%,48 8.5%,49 and 8%50 of the states’ workforces, respectively.
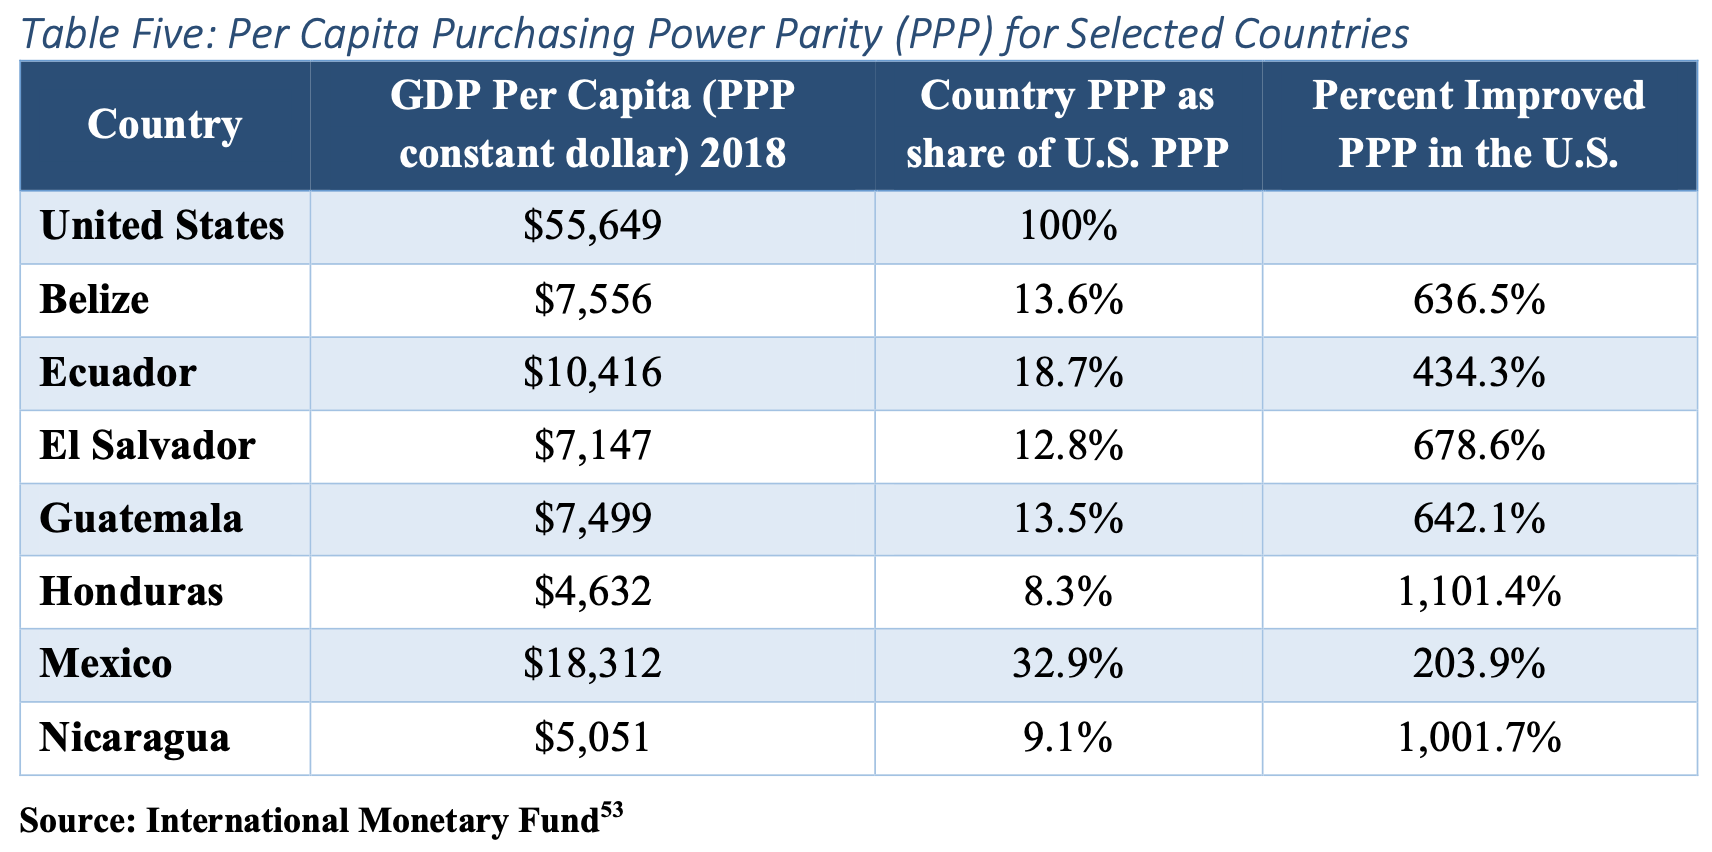
From the table, we see that the U.S. spends close to 20% of its GDP on social assistance programs at a value of $11,112 per capita. In contrast, Mexico spends less than 2% of its GDP on social assistance programs at a value of $323 per capita. All three Northern Triangle countries spend less than 1%, with values less than $75 per capita – Guatemala is only $17 of public spending per capita.(58) This massive US vs. Latin America disparity in government social welfare spending, intended for citizens rather than illegal migrants, provides a mammoth incentive for economic migrants to trespass into America.
C. Drug Trafficking and Human Trafficking
Lucrative employment and entrepreneurial opportunities in the illegal drug and human trafficking trades represent a third important force incentivizing illegal mass migration.
Today, thousands of illegal aliens, including children, are being trafficked for sexual exploitation or forced labor.(59) The State Department’s annual Trafficking in Persons report recognized the following groups as being especially susceptible to forced labor and sex slavery in the United States: “children in the child welfare and juvenile justice systems,” “unaccompanied foreign national children without lawful immigration status,” “migrant laborers, including undocumented workers and participants in visa programs for temporary workers,” “persons with limited English proficiency,” among others.(60)
Many coyotes that provide border crossing services to illegal aliens also partner with sex trafficking rings. These coyotes transport human trafficking victims to the United States on behalf of gangs, cartels, and other transnational criminal organizations.(61)
Thousands more illegal aliens are used as “mules” to cross the U.S. border, smuggling drugs like cocaine, heroin, marijuana, methamphetamines, and fentanyl into America.(62) Some of these mules will remain in the U.S. after crossing the border.(63)
Table Seven documents the seizures of cocaine, fentanyl, heroin, marijuana, and methamphetamine in 2018. These seizures have a total street value of over $6.5 billion.
The Senate Committee on Homeland Security and Governmental Affairs reports that only 5% to 10% of illegal drugs crossing America’s southern border are interdicted.(64) This suggests a drug cartel business model with annual revenues of between $66 and $132 billion, for just the U.S.-Mexican border trade – and there are likely thousands of drug mules involved in this smuggling.(65)
D. Asylum Seekers – Legitimate and False
A fourth force lure for illegal mass migration involves various avenues for illegal aliens to make both legitimate and false claims of asylum.
Asylum claims must be based on one of five forms of persecution: race, religion, nationality, membership in a particular social group, or political opinion.(67)
Figure Three illustrates the trend in asylum claims from 2008 to 2019 while Table Eight illustrates the number of asylum claim hearings and claims granted in Fiscal Year 2018-2019. As depicted, claims were relatively flat to declining until 2015 and ranged between 35,000 and 45,000 per year. However, following a 2015 District Court decision by Judge Dolly Gee, the number of asylum claims vaulted higher to over 213,000 in 2019.(68)
Section V of this report discusses at greater length the ramifications of the Judge Gee decision, from the growth in the number of asylum claims to the changing patterns of illegal immigration. For now, note that the shockingly low rate of asylum claimant success in US courts points to the massive abuse of our country’s generosity, as depicted in Table Eight.
Figure Three: Trend in Total Cases and Asylum Claims, FY08-FY19

Endnotes
1. “Bill Clinton – How/Why We Should Keep Illegal Immigrants Out of America,” 1995 State of the Union, via C-SPAN, 24 January 1995. https://www.c-span.org/video/?c4689871/bill-clinton-howwhy-illegal-immigrants-america
2 “Remarks by President Trump and Members of the Angel Families on Immigration,” The White House, June 22, 2018. https://trumpwhitehouse.archives.gov/briefings-statements/remarks-president-trump-members-angel-families-immigration/
3 O’Brien, Matt et all, “The Fiscal Burden of Illegal Immigration on United States Taxpayers,” FAIR, September 27, 2018. https://www.fairus.org/issue/publications-resources/fiscal-burden-illegal-immigration-united-states-taxpayers
4 Giaritelli, Anna, “Trump hits 450 mile Goal for 2020 Border Wall Construction,” The Washington Examiner, January 5, 2021. https://www.washingtonexaminer.com/news/trump-hits-450-mile-goal-for-2020-border-wall-construction
5 “Immigration,” The White House. https://trumpwhitehouse.archives.gov/issues/immigration/
6 “Executive Order on the Revision of Civil Immigration Enforcement Policies and Priorities,” The White House, January 20, 2021. https://www.whitehouse.gov/briefing-room/presidential-actions/2021/01/20/executive-order-the-revision-of-civil-immigration-enforcement-policies-and-priorities/
7 “Proclamation on the Termination Of Emergency With Respect To The Southern Border Of The United States And Redirection Of Funds Diverted To Border Wall Construction,” The White House, January 20, 2021. https://www.whitehouse.gov/briefing-room/presidential-actions/2021/01/20/proclamation-termination-of-emergency-with-respect-to-southern-border-of-united-states-and-redirection-of-funds-diverted-to-border-wall-construction/
8 “Monthly number of unemployed persons in the U.S. from January 2020 to January 2021,” Statista, https://www.statista.com/statistics/193280/seasonally-adjusted-monthly-number-of-unemployed-persons-in-the-usa/
9. “Invisible Victims: Migrants on the move in Mexico,” Amnesty International, 2010.https://www.statista.com/statistics/193280/seasonally-adjusted-monthly-number-of-unemployed-persons-in-the-usa/
10 International Organization For Migration (IOM), Migrant Routes: Americas 2016, IOM Regional Office for Central and North America and the Caribbean and IOM Costa Rica, March 2016.
11. “Migration and Its impact on Cities.” World Economic Forum, October 2017. http://www3.weforum.org/docs/Migration_Impact_Cities_report_2017_HR.pdf
12 See: Semple, Kirk. “Fleeing Gangs, Central American Families Surge Toward U.S.,” New York Times. 12 November 2016. https://www.nytimes.com/2016/11/13/world/americas/fleeing-gangs-central-american-families-surge-toward-us.html
This article discusses how over 400,000 tried to cross in 2016. While this does not explicitly state that thousands of illegal aliens are on these migratory routes, nearly 49% of these immigrants were from Guatemala, Honduras, and El Salvador, which requires their use of these migratory routes.
13 https://www.cbp.gov/newsroom/stats/sw-border-migration/fy-2019
14 U.S. Department of Homeland Security, U.S. Border Patrol, “Southwest Border Migration FY 2019,” 2019. https://www.cbp.gov/newsroom/stats/sw-border-migration
Note: Unaccompanied children apprehensions account for about 9.24% of border apprehensions, not including children apart of family units. The percent of children traveling along the migratory route may very well be much higher. Every family unit is required to have at least child in their party to qualify as a family unit. Internal contacts from Department of Homeland Security estimate that roughly 28% of border encounters are minors.
15 Information provided from contacts at the Department of Homeland Security, Office of Immigration Statistics. Numbers derived from an analysis of Lifecycle Data.
16 “Forced to Flee Central America’s Northern Triangle: A Neglected Humanitarian Crisis”, Doctors without Borders. 2017. https://www.doctorswithoutborders.ca/sites/default/files/msf_forced-to-flee-central-americas-northern-triangle_0.pdf
17 The most recent report has the sexual assault rate at 80%, for this see: Bonello, Deborah and Erin McIntyre, “Is Rape the Price to Pay for Migrant Women Chasing the American Dream?” Splinter, 10 September 2014.
18 Johnson, Ron, “The State of America’s Border Security,” Committee on Homeland Security and Governmental Affairs. United States Senate. 23 November 2015. https://www.hsgac.senate.gov/imo/media/doc/Final%20Border%20Report.pdf
19 Johnson, Ron, “The State of America’s Border Security,” Committee on Homeland Security and Governmental Affairs. United States Senate. 23 November 2015. https://www.hsgac.senate.gov/imo/media/doc/Final%20Border%20Report.pdf
20 “Total Arrivals” for this chart is the sum of apprehensions, inadmissables, and estimated get-aways. It fails to account for the “turn-back” population, which are aliens who cross the border, and then turn back when faced by CBP forces. There are also other “unknown unknowns” that may add to this number.
21 Information provided via email from internal contacts at U.S. Customs and Border Protection.
22. “Southwest Border Migration FY 2020.” U.S. Customs and Border Patrol, https://www.cbp.gov/newsroom/stats/sw-border-migration-fy2020
23 For apprehensions to date FY19 see: U.S. Department of Homeland Security, Customs and Border Protection, “U.S. Border Patrol Southwest Border Apprehensions by Sector Fiscal Year 2019,” accessed July 31, 2019, https://www.cbp.gov/newsroom/stats/sw-border-migration/usbp-sw-border-apprehensions. For inadmissables, see: U.S. Department of Homeland Security, Customs and Border Protection, “Southwest Border Inadmissibles by Field Office Fiscal Year 2019,” www.cbp.gov/newsroom/stats/sw-border-migration/ofo-sw-border-inadmissibles.
24 U.S. Department of Homeland Security, U.S. Citizenship and Immigration Services, “Inadmissibility and Waivers,” https://www.uscis.gov/sites/default/files/USCIS/About%20Us/Electronic%20Reading%20Room/Applicant%20Serv ice%20Reference%20Guide/Inadmissibillity_and_Waivers.pdf
25 U.S. Department of Homeland Security, Office of Immigration Statistics, “Efforts by DHS to Estimate Southwest Border Security between Ports of Entry,” September 2017. https://www.dhs.gov/sites/default/files/publications/17_0914_estimates-of-border-security.pdf
26 Kirkwood, Cort, “100K Illegals Got Away From Border Agents,” The New American, June 21, 2019. https://thenewamerican.com/100k-illegals-got-away-from-border-agents/
See Also
Chamberlain, Samuel, “More than 100,000 Migrants Apprehended or Turned Away at the border in March, CBP Reveals,” Fox News, April 9, 2019. https://www.foxnews.com/us/more-than-100000-migrants-apprehended-or-turned-away-at-border-in-march-cbp-reveals
See Also
“Efforts by DHS to Estimate Southwest Border Security between Ports of Entry,” Department of Homeland Security, September 2017. https://www.dhs.gov/sites/default/files/publications/17_0914_estimates-of-border-security.pdf
27 In May 2019, the U.S. Border Patrol reported the most apprehensions of immigrants at 132,859. However, there was a decline in apprehensions, by 60%, to 50,693 in August 2019. Since a June 2019 deal with Mexico, expanding the “remain in Mexico” policy, the U.S. has sent approximately 42,000 non-Mexican migrants to Mexico to await their hearings.
U.S. Department of Homeland Security, U.S. Border Patrol, “Southwest Border Migration FY 2019,” 2019. https://www.cbp.gov/newsroom/stats/sw-border-migration
28 The sum of total apprehensions, inadmissibles, and “got aways” for FY19 have already exceeded one million and one month of apprehensions data still remains to be collected in FY19.
U.S. Department of Homeland Security, U.S. Border Patrol, “Southwest Border Migration FY 2019,” 2019. https://www.cbp.gov/newsroom/stats/sw-border-migration
29 “U.S. Immigration and Customs Enforcement Fiscal Year 2019 Enforcement and Removal Operations Report,” U.S. Immigration and Customs Enforcement, https://www.ice.gov/sites/default/files/documents/Document/2019/eroReportFY2019.pdf
30 “ICE details COVID-19 impacts on immigration enforcement in FY 2020,” U.S. Immigration and Customs Enforcement. https://www.ice.gov/features/ERO-2020
31 “Table 41. Aliens Removed by Criminal Status and Region and Country of Nationality: Fiscal Year 2018,” U.S. Department of Homeland Security, https://www.dhs.gov/immigration-statistics/yearbook/2018/table41
32 Internal contacts from the Department of Homeland Security, Office of Immigration Statistics.
33 U.S. Department of Homeland Security, Customs and Border Protection, “U.S. Border Patrol nationwide Apprehensions by Citizenship and Sector in FY2019,” https://www.cbp.gov/sites/default/files/assets/documents/2020- Jan/U.S.%20Border%20Patrol%20Nationwide%20Apprehensions%20by%20Citizenship%20and%20Sector%20%2 8FY2007%20-%20FY%202019%29_1.pdf
34 U.S. Department of Homeland Security, Customs and Border Protection, “U.S. Border Patrol nationwide Apprehensions by Citizenship and Sector in FY2018,” www.cbp.gov/sites/default/files/assets/documents/2019-Mar/BP%20Apps%20by%20Sector%20and%20Citizenship%20FY07-FY18.pdf
35 U.S. Department of Homeland Security, Customs and Border Protection, “U.S. Border Patrol nationwide Apprehensions by Citizenship and Sector in FY2018,” www.cbp.gov/sites/default/files/assets/documents/2019-Mar/BP%20Apps%20by%20Sector%20and%20Citizenship%20FY07-FY18.pdf
36 U.S. Department of Homeland Security, Customs and Border Protection, “U.S. Border Patrol nationwide Apprehensions by Citizenship and Sector in FY2019,” https://www.cbp.gov/sites/default/files/assets/documents/2020- Jan/U.S.%20Border%20Patrol%20Nationwide%20Apprehensions%20by%20Citizenship%20and%20Sector%20%2 8FY2007%20-%20FY%202019%29_1.pdf
37 For information on illegal alien transit through Brazil see for instance: Bengali, Shashank, “They Gambled, and Lost: Dozens of Migrants Braved Thousands of Miles of Jungles, Seas, and Bandits to reach the U.S. Then They Were Sent Home,” Los Angeles Times, 24 December 2016.
As noted in this article: “South Asians have become some of the biggest users of this expanding immigration pipeline. In the 11 months ending in August 2016, at least 4,060 Bangladeshis, Indians, Nepalis and Pakistanis traveled to the U.S. along this route, compared with just 225 seven years earlier, according to Customs and Border Protection statistics. Of those, 3,604 were arrested while crossing illegally, nearly a fourfold increase from 2012.”
38 U.S. Department of Homeland Security, Customs and Border Protection, “U.S. Border Patrol nationwide Apprehensions by Citizenship and Sector in FY2018,” www.cbp.gov/sites/default/files/assets/documents/2019-Mar/BP%20Apps%20by%20Sector%20and%20Citizenship%20FY07-FY18.pdf
39 U.S. Department of Homeland Security, Customs and Border Protection, “U.S. Border Patrol Southwest Border Apprehensions by Sector Fiscal Year 2018,” https://www.cbp.gov/newsroom/stats/sw-border-migration/usbp-sw-border-apprehensions
U.S. Department of Homeland Security, Customs and Border Protection, “U.S. Border Patrol Southwest Border Apprehensions by Sector Fiscal Year 2019,” https://www.cbp.gov/newsroom/stats/sw-border-migration/usbp-sw-border-apprehensions
40 U.S. Department of Homeland Security, Customs and Border Protection, “U.S. Border Patrol Nationwide Apprehensions by Citizenship and Sector in FY2018,” www.cbp.gov/sites/default/files/assets/documents/2019-Mar/BP%20Apps%20by%20Sector%20and%20Citizenship%20FY07-FY18.pdf
41 Note: Illegal aliens who speak English “proficiently” either speak only English at home or, if not, indicate they can speak English “very well”. Percentages are Pew Research Center estimates based on augmented American Community Survey (IPUMS). Within this self-reporting survey, English proficiency is measured on a scale of one to four, as follows:
1.) Speaks English Very Well
2.) Speaks English Well
3.) Does not speak English Well
4.) Speaks no English
This 75% statistic is reflective of the sum of those who reported 2-4.
Passel, Jeffrey. “U.S. unauthorized immigrants are more proficient in English, more educated than a decade ago,” Pew Research Center. 23 May 2019. https://www.pewresearch.org/fact-tank/2019/05/23/u-s-undocumented-immigrants-are-more-proficient-in-english-more-educated-than-a-decade-ago/
42 Passel, Jeffrey. “U.S. unauthorized immigrants are more proficient in English, more educated than a decade ago,” Pew Research Center. 23 May 2019. https://www.pewresearch.org/fact-tank/2019/05/23/u-s-undocumented-immigrants-are-more-proficient-in-english-more-educated-than-a-decade-ago/
43 “Detailed Industries with Highest Shares of Unauthorized Immigrant Workers, 2014,” Pew Research Center Hispanic Trends. 26 March 2015. https://www.pewhispanic.org/2015/03/26/share-of-unauthorized-immigrant-workers-in-production-construction-jobs-falls-since-2007/ph_2015-03-26_unauthorized-immigrants-testimony-report-23/
This is the most current and thorough information we could find on specific occupations held by illegal aliens. There is more updated, broad information on the industries in which most illegal aliens are employed. The broad information is reflective of a similar occupational breakdown as listed above. See: Passel, Jeffrey and D’Vera Cohn, “Size of the U.S. Unauthorized Immigrant Workforce Stable After the Great Recession,” Pew Research Center. 3 November 2016. https://www.pewresearch.org/hispanic/2016/11/03/size-of-u-s-unauthorized-immigrant-workforce-stable-after-the-great-recession/
For average salary calculations, see: U.S. Department of Labor, Bureau of Labor Statistics, “May 2018 National Occupational Employment and Wage Estimates United States,” https://www.bls.gov/oes/current/oes_nat.htm#00-0000
44 U.S. Department of Labor, Bureau of Labor Statistics, “May 2018 National Occupational Employment and Wage Estimates United States,” https://www.bls.gov/oes/current/oes_nat.htm#00-0000
45 In 2017, Pew Research Center reported that illegal immigrants residing in the U.S. make up 3.2% of the total U.S. population.
Krogstad, Jen and Jeffrey Passel, “5 facts about illegal immigration in the U.S.,” Pew Research Center. https://www.pewresearch.org/fact-tank/2019/06/12/5-facts-about-illegal-immigration-in-the-u-s/
46 “Detailed Industries with Highest Shares of Unauthorized Immigrant Workers, 2014,” Pew Research Center Hispanic Trends. 26 March 2015. https://www.pewhispanic.org/2015/03/26/share-of-unauthorized-immigrant-workers-in-production-construction-jobs-falls-since-2007/ph_2015-03-26_unauthorized-immigrants-testimony-report-23/
47. “Immigrants in Nevada,” American Immigration Council, August 6, 2020. https://www.americanimmigrationcouncil.org/research/immigrants-in-nevada
In 2016, there were 210,000 undocumented immigrants which comprised 35 percent of the immigrant population and 7 percent of the total state population. There is not more recent publicly available data.
See Also
“Unauthorized immigrant population trends for states, birth countries and regions,” Pew Research Center, June 12, 2019. https://www.pewresearch.org/hispanic/interactives/unauthorized-trends/
48. “Immigrants in California.” American Immigration Council, August 6, 2020.
https://www.americanimmigrationcouncil.org/research/immigrants-in-texas
See Also
“U.S. unauthorized immigrant population estimates by state, 2016,” Pew Research Center, February 5, 2019. https://www.pewresearch.org/hispanic/interactives/u-s-unauthorized-immigrants-by-state/
50 “Immigrants in New Jersey,” American Immigration Council,
https://www.americanimmigrationcouncil.org/sites/default/files/research/immigrants_in_new_jersey.pdf
See Also
“U.S. unauthorized immigrant population estimates by state, 2016,” Pew Research Center, February 5, 2019. https://www.pewresearch.org/hispanic/interactives/u-s-unauthorized-immigrants-by-state/