

A Report by Dr. Peter Navarro. Released February 2020.
II. Four Forces Incentivizing Illegal Mass Migration
Now that we have explored who precisely is entering the country illegally, the question remains—why are they coming here?
The four main forces that incentivize this illegal mass migration across America’s Southern border include: the search for better jobs and higher wages, ready access to much of America’s welfare state, lucrative opportunities in illegal drug and human trafficking trades, and many avenues for asylum claims in the US, both legitimate and abusive efforts.
A. Better Jobs and Higher Wages
The lure of better quality of life fueled by better and higher paying jobs represents the purest form of economic migration. According to the International Monetary Fund, the United States is the eleventh richest country in the world, (51) and the richest large country as measured by per capita nominal GDP at $66,140.52
In contrast, Mexico is ranked 71st at $9,858, Guatemala is 107th at $4,674, El Salvador is 119th at $4,027, and Honduras is 137th at $2,569.
Table Five illustrates the dramatic economic gains an illegal alien can experience by entering the U.S. workforce and boosting his or her wages. This table compares the average purchasing power parity (PPP) per capita in the United States of $59,928 with that of Mexico and selected countries from Central America.
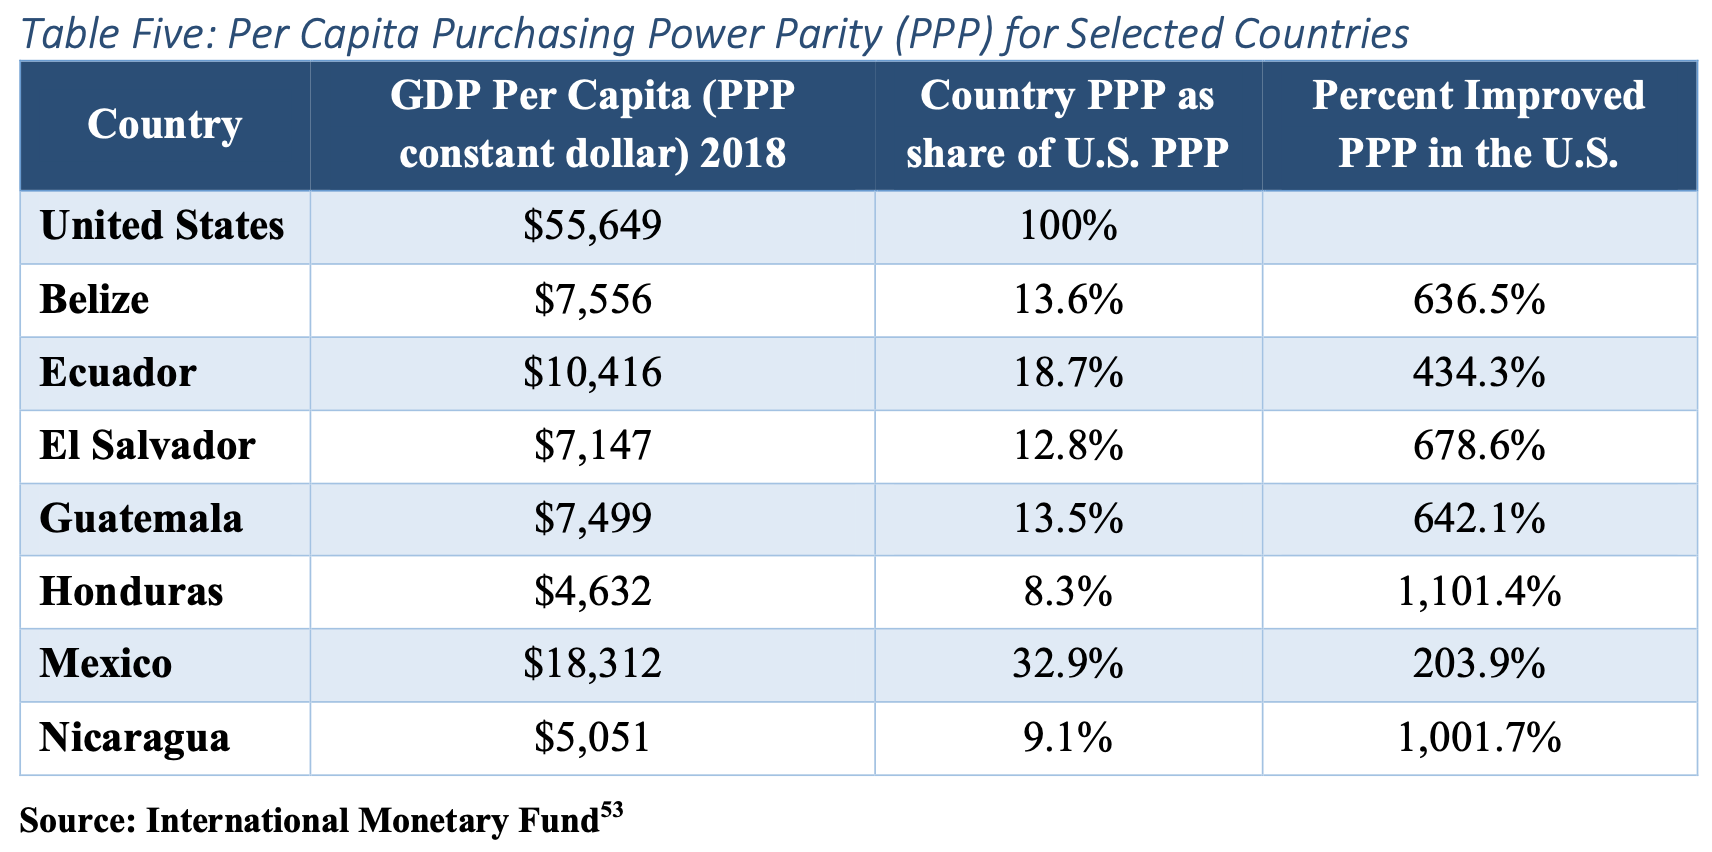
Purchasing power parity (PPP), provides a much better comparison of U.S. living standards than nominal GDP per capita because PPP adjusts for the different costs of buying a similar basket of goods and services across countries.(54) In Honduras, for example, the per capita PPP of $4,632 is only 8.3% of the average U.S. PPP. In El Salvador and Guatemala, it is 12.8% and 13.5%, respectively. Even in Mexico, per capita PPP is only 32.9% that of the U.S.
The fact is this: when illegal aliens come to the U.S., they can significantly improve their economic prospects, even if they earn wages well below the U.S. average. In turn, this illegal alien “labor shock” provides U.S. employers with additional labor market leverage to depress wages for American citizens competing with these illegal aliens—and the urban poor in America tend to suffer the most.(55)
B. Access to the American Educational, Medical, Welfare, and Other Social Services
A second force pulling illegal immigrants north represents a very different form of economic migration—the lure of easy illegal alien access to many generous offerings of the U.S. taxpayer-financed welfare state.
As discussed in more detail in Section V of this report, under U.S. law, as soon as an illegal alien takes up residency in the U.S., that individual may be immediately eligible for a wide range of educational and medical benefits, welfare, and other social services.(56)
To understand just how strong a lure the United States’ welfare state is, consider Table Six. It compares the level of per capita public spending on social assistance programs for selected countries.
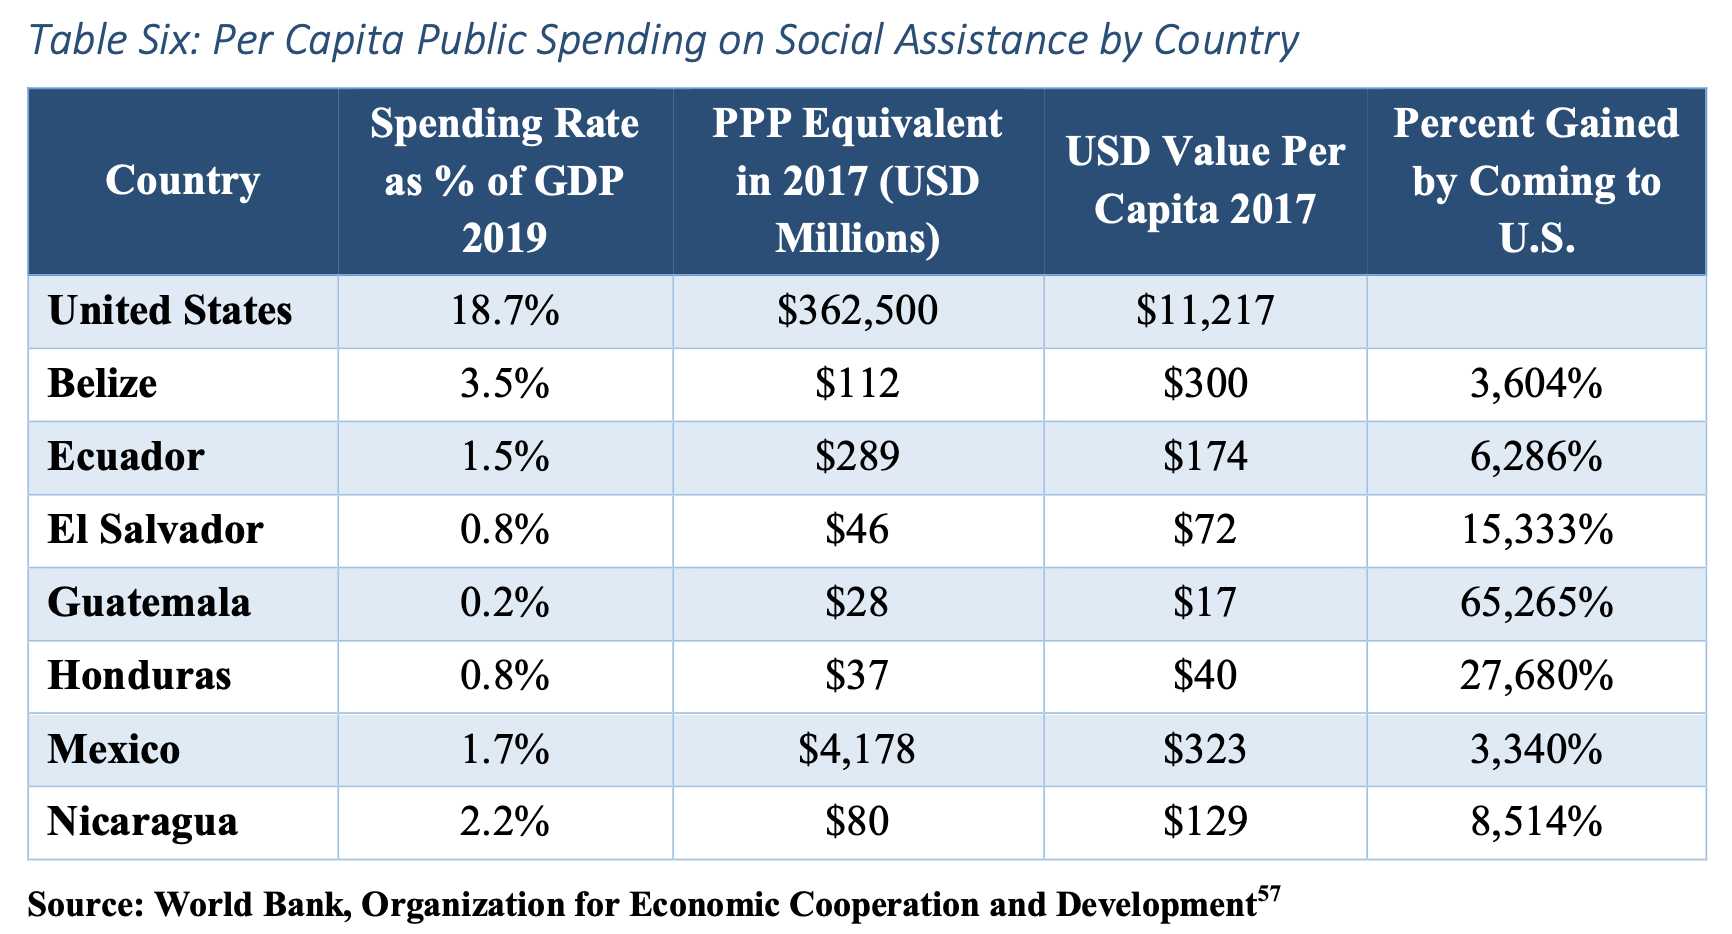
From the table, we see that the U.S. spends close to 20% of its GDP on social assistance programs at a value of $11,112 per capita. In contrast, Mexico spends less than 2% of its GDP on social assistance programs at a value of $323 per capita. All three Northern Triangle countries spend less than 1%, with values less than $75 per capita – Guatemala is only $17 of public spending per capita.(58) This massive US vs. Latin America disparity in government social welfare spending, intended for citizens rather than illegal migrants, provides a mammoth incentive for economic migrants to trespass into America.
C. Drug Trafficking and Human Trafficking
Lucrative employment and entrepreneurial opportunities in the illegal drug and human trafficking trades represent a third important force incentivizing illegal mass migration.
Today, thousands of illegal aliens, including children, are being trafficked for sexual exploitation or forced labor.(59) The State Department’s annual Trafficking in Persons report recognized the following groups as being especially susceptible to forced labor and sex slavery in the United States: “children in the child welfare and juvenile justice systems,” “unaccompanied foreign national children without lawful immigration status,” “migrant laborers, including undocumented workers and participants in visa programs for temporary workers,” “persons with limited English proficiency,” among others.(60)
Many coyotes that provide border crossing services to illegal aliens also partner with sex trafficking rings. These coyotes transport human trafficking victims to the United States on behalf of gangs, cartels, and other transnational criminal organizations.(61)
Thousands more illegal aliens are used as “mules” to cross the U.S. border, smuggling drugs like cocaine, heroin, marijuana, methamphetamines, and fentanyl into America.(62) Some of these mules will remain in the U.S. after crossing the border.(63)
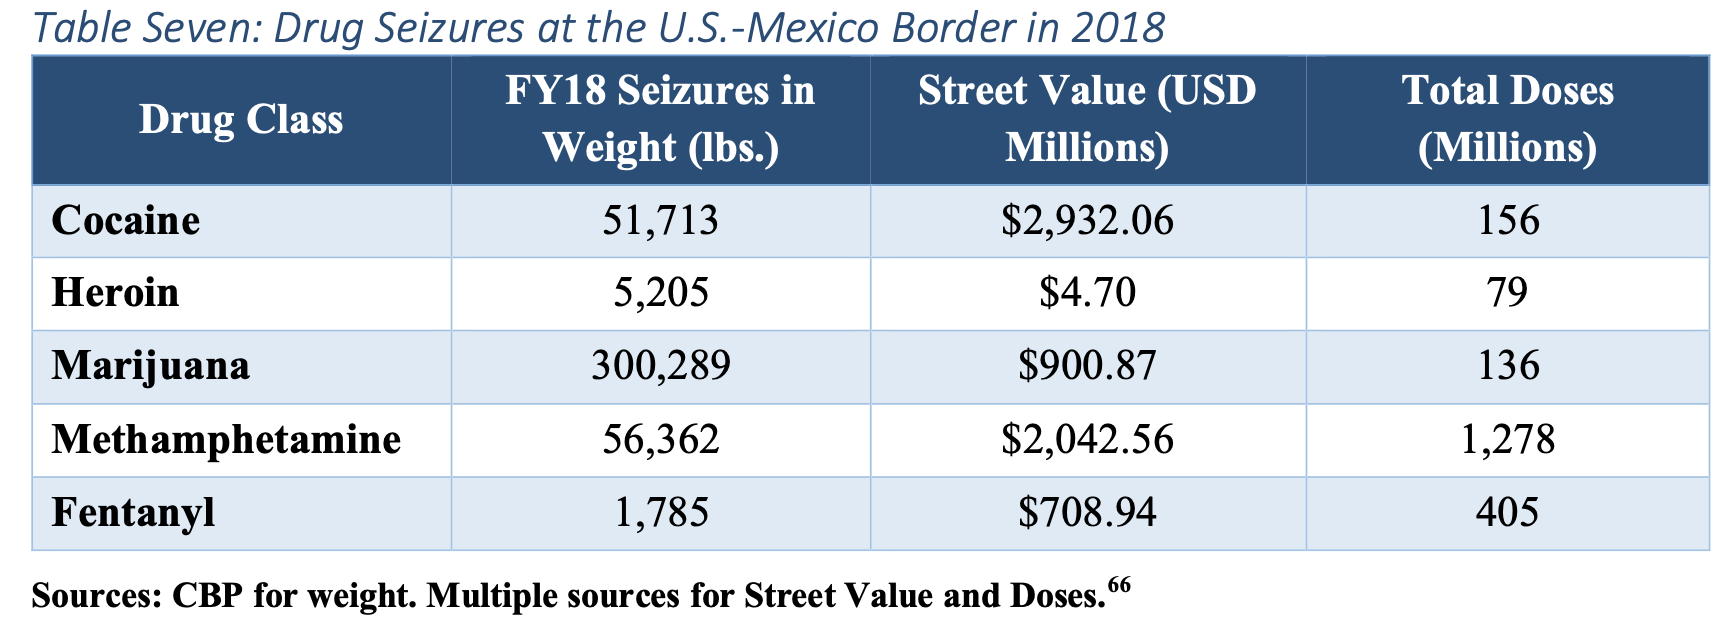
Table Seven documents the seizures of cocaine, fentanyl, heroin, marijuana, and methamphetamine in 2018. These seizures have a total street value of over $6.5 billion.
The Senate Committee on Homeland Security and Governmental Affairs reports that only 5% to 10% of illegal drugs crossing America’s southern border are interdicted.(64) This suggests a drug cartel business model with annual revenues of between $66 and $132 billion, for just the U.S.-Mexican border trade – and there are likely thousands of drug mules involved in this smuggling.(65)
D. Asylum Seekers – Legitimate and False
A fourth force lure for illegal mass migration involves various avenues for illegal aliens to make both legitimate and false claims of asylum.
Asylum claims must be based on one of five forms of persecution: race, religion, nationality, membership in a particular social group, or political opinion.(67)
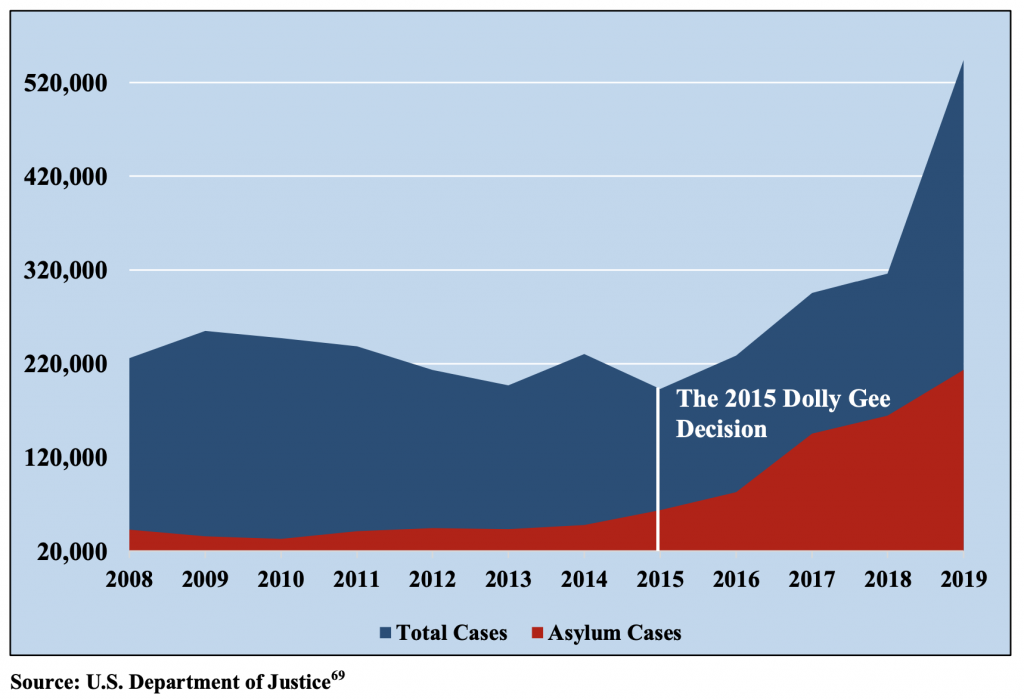
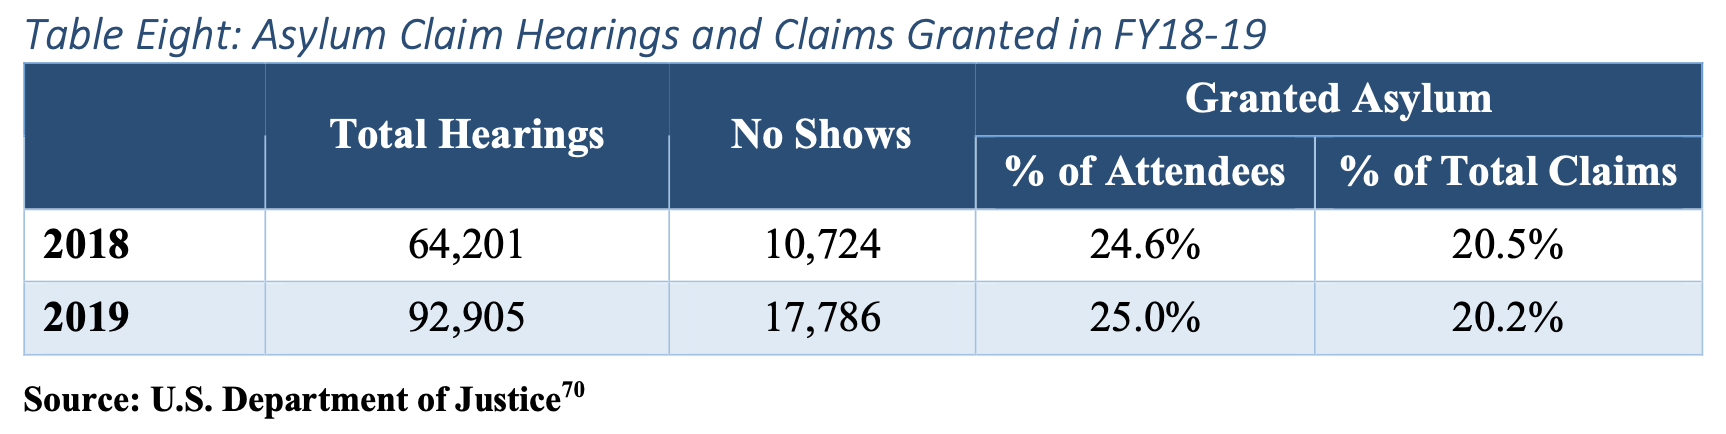
Figure Three illustrates the trend in asylum claims from 2008 to 2019 while Table Eight illustrates the number of asylum claim hearings and claims granted in Fiscal Year 2018-2019. As depicted, claims were relatively flat to declining until 2015 and ranged between 35,000 and 45,000 per year. However, following a 2015 District Court decision by Judge Dolly Gee, the number of asylum claims vaulted higher to over 213,000 in 2019.(68)
Section V of this report discusses at greater length the ramifications of the Judge Gee decision, from the growth in the number of asylum claims to the changing patterns of illegal immigration. For now, note that the shockingly low rate of asylum claimant success in US courts points to the massive abuse of our country’s generosity, as depicted in Table Eight.
Figure Three: Trend in Total Cases and Asylum Claims, FY08-FY19
51 Ventura, Luca, “Richest Countries in the World 2020,” Global Finance, February 20, 2021. https://www.gfmag.com/global-data/economic-data/richest-countries-in-the-world
52 Only Ireland, Luxembourg, Norway and Switzerland, rank above the United States.
“World Economic Outlook Database,” GDP Per capita, current prices 2020, International Monetary Fund. Accessed 22 January 2021. https://www.imf.org/external/datamapper/NGDPDPC@WEO/AZE/USA
53 International Monetary Fund, “Gross domestic product per capita, constant prices, Purchasing power parity; 2011 international dollars, 2018” Accessed on 26 August 2020. https://www.imf.org/external/pubs/ft/weo/2019/01/weodata/weorept.aspx?sy=2017&ey=2024&scsm=1&ssd=1&sor t=country&ds=.&br=1&pr1.x=70&pr1.y=13&c=273%2C339%2C278%2C248%2C253%2C258%2C268%2C111& s=NGDPRPPPPC%2CPPPPC&grp=0&a=#download
54 “Adjusting for Price Differences Across the World,” The World Bank. Accessed July 31, 2019. http://datatopics.worldbank.org/world-development-indicators/stories/adjusting-for-price-differences-across-the-world.html
55 “The Impact of Illegal Immigration on the Wages and Employment Opportunities of Black Workers,” United States Commission on Civil Rights. https://www.usccr.gov/pubs/docs/IllegImmig_10-14-10_430pm.pdf
56 Seward, James L. “What Benefits Can Illegal Aliens Receive?” The New York State Senate. https://www.nysenate.gov/newsroom/articles/james-l-seward/what-benefits-can-illegal-aliens-receive
57 Note: social assistance programs are defined as the following by the World Bank: as “poverty targeted cash transfers and last resort programs; family/children/orphan allowance; non-contributory funeral grants and burial allowances; emergency cash support; conditional cash transfers; public charity; old age non-contributory social pensions; non-contributory disability benefits/ war victims related benefits; survivorship; food stamps, rations and vouchers; food distribution programs; nutritional programs; in-kind/non-food support, such as education supplies, free text books and uniforms; school feeding; cash and food for work; health insurance exemptions and reduced medical fees; education fee waivers; food subsidies; housing subsidies and allowances; utility and electricity subsidies and allowances; agricultural inputs subsidies; publically funded scholarships and educational benefits; and social care services.”
For classifying social assistance: “Aspire Program Classification,” The World Bank. http://pubdocs.worldbank.org/en/340871485449612510/ASPIRE-program-classification.pdf
“The Atlas of Social Protection – Indicators of Resilience and Equity by Country,” The World Bank, Accessed August 7, 2019. http://datatopics.worldbank.org/aspire/country/el-salvador
“Social Spending, OECD Data,” Organisation for Economic Co-operation and Development, Accessed August 7, 2019. https://data.oecd.org/socialexp/social-spending.htm
“The World FactBook: Country Comparison, GDP Purchasing Power Party,” U.S. Central Intelligence Agency, Accessed August 7, 2019. https://www.cia.gov/library/publications/the-world-factbook/rankorder/2001rank.html
“Population: Total by Country,” The World Bank. Accessed August 7, 2019. https://data.worldbank.org/indicator/SP.POP.TOTL
58 “The Atlas of Social Protection – Indicators of Resilience and Equity by Country,” The World Bank, Accessed August 7, 2019. http://datatopics.worldbank.org/aspire/country/el-salvador
“Social Spending, OECD Data,” Organisation for Economic Co-operation and Development, Accessed August 7, 2019. https://data.oecd.org/socialexp/social-spending.htm
“The World FactBook: Country Comparison, GDP Purchasing Power Party,” U.S. Central Intelligence Agency, Accessed August 7, 2019. https://www.cia.gov/library/publications/the-world-factbook/rankorder/2001rank.html
59 “Human Trafficking: Modern Enslavement of Immigrant Women in the United States,” American Civil Liberties Union (ACLU). https://www.aclu.org/other/human-trafficking-modern-enslavement-immigrant-women-united-states
60 U.S. State Department, “Trafficking in Persons Report,” June 2019. https://www.state.gov/wp-content/uploads/2019/06/2019-Trafficking-in-Persons-Report.pdf
61 Johnson, Ron, “The State of America’s Border Security,” Committee on Homeland Security and Governmental Affairs. United States Senate. 23 November 2015. https://www.hsgac.senate.gov/imo/media/doc/Final%20Border%20Report.pdf
62 U.S. Department of Justice, Drug Enforcement Administration, “2018 National Drug Threat Assessment,” https://www.dea.gov/sites/default/files/2018-11/DIR-032-18%202018%20NDTA%20final%20low%20resolution.pdf
63 Davidson, John Daniel, “Illegal Immigration is Earning Billions for Smugglers,” The Federalist. 24 April 2019. https://thefederalist.com/2019/04/24/illegal-immigration-depopulating-central-america-earning-billions-smugglers/
64 U.S. Senate, Committee on Homeland Security and Governmental Affairs, Majority Staff Report, “The State of America’s Border Security,” 23 November 2015.
65 This was calculated by taking the 5 to 10 percent interdiction rate estimated by the Senate report and the total monetary equivalent of FY18 seized drugs along Southern border ports of entry from Table 7.
66 U.S. Senate, Committee on Homeland Security and Governmental Affairs, Majority Staff Report, “The State of America’s Border Security,” 23 November 2015.
In order to calculate the doses that could have been generated from FY18 seizures, we researched the average dose or overdose quantity for each drug and considered how many doses are in the seized amount. For the street value, we researched the cost of the drug in a particular quantity and converted it to pounds in order to multiply the amount seized to find an overall cost. The street value represents the cost that could be generated from the seized drugs. The street price and the average dose for the aforementioned drugs are the following:
Cocaine: estimated street price is $100-$150/gram. See, “Cocaine and crack drug profile,” European Monitoring Centre for Drugs and Drug Addiction, http://www.emcdda.europa.eu/publications/drug-profiles/cocaine
Average dose estimate is 150mg. See, “The Cost of Addiction.” Rehab Spot, https://www.rehabspot.com/treatment/paying-for-rehab/cost-of-addiction/
Heroin: estimated street price is $900/pure gram. See, U.S. Department of Justice, Drug Enforcement Administration, “2018 National Drug Threat Assessment,” https://www.dea.gov/sites/default/files/2018-11/DIR-032-18%202018%20NDTA%20final%20low%20resolution.pdf
Estimated average lethal does is 30mg. See, Bond, Allison, “What fentanyl is deadlier in heroin, in a single photo,” Stat News. 29 September 2016. https://www.statnews.com/2016/09/29/why-fentanyl-is-deadlier-than-heroin/
Marijuana: estimated street price ranges $2,000-$4,000/lb. See, “The Cost of Addiction,” Rehab Spot, https://www.rehabspot.com/treatment/paying-for-rehab/cost-of-addiction/
Average dose estimates are difficult to determine due to the many consumption methods. A joint has anywhere from 0.5 grams to 1 gram. Edible consumption requires more marijuana for the same high effect. For estimation purposes, an average dose is assumed at 1 gram.
Chokshi, Niraj, “How Much Weed is in a Joint? Pot Experts Have a New Estimate.” New York Times. 14 July 2016. https://www.nytimes.com/2016/07/15/science/how-much-weed-is-in-a-joint-pot-experts-have-a-new-estimate.html
Barreda, Alejandra, Kristine De Leion, and Stefani Urmas, “A simple guide to pot, THC and how much is too much,” Los Angeles Times. 20 April 2018. https://www.latimes.com/projects/la-me-weed-101-thc-calculator/
Methamphetamine: estimated street price is $70/gram. See, U.S. Department of Justice, Drug Enforcement Administration, “2018 National Drug Threat Assessment,” https://www.dea.gov/sites/default/files/2018-11/DIR-032-18%202018%20NDTA%20final%20low%20resolution.pdf
Average dose estimate is 20mg. See, National Institutes of Health, Marilyn A. Huestis and Edward J. Cone, “Methamphetamine Disposition in Oral Fluid, Plasma, and Urine,” NY Academic Science: 104-121. 1 March 2007. https://www.ncbi.nlm.nih.gov/pmc/articles/PMC2709797/
Fentanyl: estimated street price is $397,163/lb. See, U.S. Department of Justice, Drug Enforcement Administration, “32 Kilograms of fentanyl worth $28.8 million seized and two Dominican Nationals arrested for trafficking,” 23 October 2018. https://www.dea.gov/press-releases/2018/10/23/32-kilograms-fentanyl-worth-288-million-seized-and-two-dominican
Estimated average lethal dose is 2 mg. See, U.S. Department of Justice, Drug Enforcement Administration, “DEA Issues Carfentanil Warning to Police and Public,” 22 September 2016. https://www.dea.gov/press-releases/2016/09/22/dea-issues-carfentanil-warning-police-and-public
67 “Asylum,” 8 U.S. Code § 1158, Cornell Law School – Legal Information Institute. https://www.law.cornell.edu/uscode/text/8/1158
68 U.S. Department of Justice, Executive Office for Immigration Review Adjudication Statistics, “New Cases and Total Completions,” https://www.justice.gov/eoir/page/file/1060841/download
69 U.S. Department of Justice, Executive Office for Immigration Review Adjudication Statistics, “New Cases and Total Completions,” https://www.justice.gov/eoir/page/file/1060841/download
70 U.S. Department of Justice, Executive Office for Immigration Review Adjudication Statistics, “Asylum Decision Rates,” 23 October 2019. https://www.justice.gov/eoir/page/file/1163686/download
U.S. Department of Justice, Executive Office for Immigration Review Adjudication Statistics, “In Absentia Removal Orders in Cases Originating with a credible Fear Claim,” 15 April 2020. https://www.justice.gov/eoir/page/file/1116666/download